Honeywell Sustainability+ for Enterprise
Emissions Management
0 to 1 Product Design Enterprise/SaaS 7 Months

OVERVIEW
Honeywell Forge Sustainability+ is a SaaS platform that helps industries manage emissions with accurate and swift data reconciliation. It tracks greenhouse gas calculations, including methane, and helps monitor targets and key performance indicators. This provides a hassle-free process to achieve reporting requirements with speed and accuracy. The industry is collaborating to develop strategies to target methane emissions and achieve net-zero emissions. Honeywell gas cloud imaging technology helps the oil and gas industry monitor methane emissions and detect leaks quickly, easily, and effectively.
Background
PROBLEM
Chief Sustainability Officers from companies like Shell and Chevron, who rely on Honeywell products to manage emissions, are unable to track carbon emissions, and HSE Engineers are unable to identify and control leaks.
GOAL
Design a digital transformation solution for Sustainability Officers and HSE engineers to measure carbon emissions and detect methane leaks. Which will provide valuable insights to support climate action initiatives and monitor progress toward net-zero emissions, while also helping to avoid costly waste emissions taxes and regulatory penalties.
Understanding users
Evan is a Chief Sustainability Officer
Pain points
Limited Visibility of Enterprise-wide Emissions
Lack of traceability to manage and analyse compliance
Difficult to perform manual reporting + Auditing
"I want to see Emissions for last month and for the current month to date so that I can see if it is heading in the right direction"
"I don't want to wait until the end of the month to see that the monthly emission was off"
"It's very difficult to identify deviations from expected targets, and most of the data visualisations available are not configurable"
"And I need to see non-conformance data upfront "

Arjaan is an HSE/Process Engineer

Pain points
Manual data collection
Difficult to calculate emissions footprint
Data Reconciliation
"I spend too much time gathering, validating and preparing data from siloed data sources"
"I don't have easy access to insights from other expert applications"
"It is very difficult to find a root cause in layers of complex calculation and relationships"
"Collaboration to resolve issues is a challenge. It is hard to capture and re-use learning from resolved issues "
Experience Outcome

Opportunities
# Data Collection and Validation
Consolidate emissions data from multiple sources across the Enterprise for upstream O&G verticals.
# Record Keeping and Auditing
User needs to maintain a complete history of records created and modified.
# Emission Visualisation
Monitor emissions data from across the organisation in real time.
User needs configurable charts and graphs displayed in Enterprise dashboards - Regional, Site and Unit views to identify problem sources and root causes.
Future recommendations or actions to take based on past/historic data.
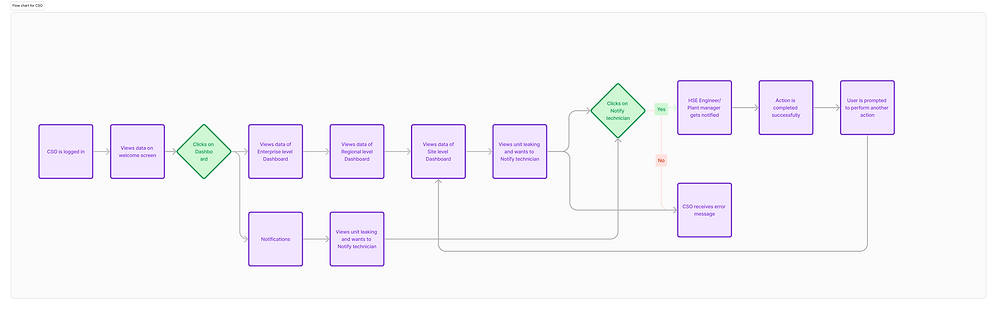
CSO User flow
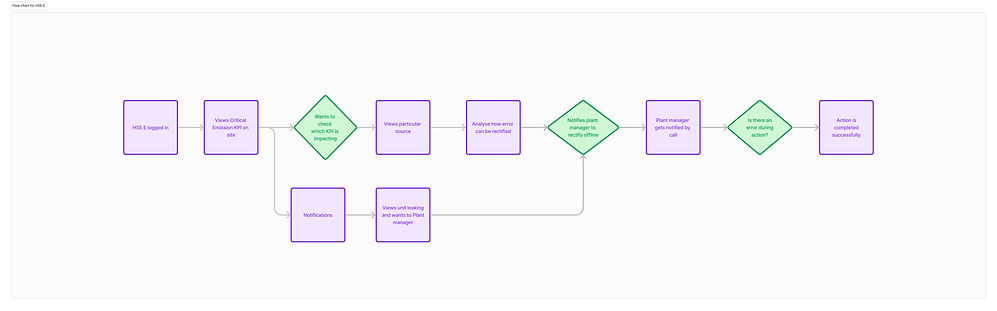
HSE Engineer User flow
Chief Sustainability
Officer Flow
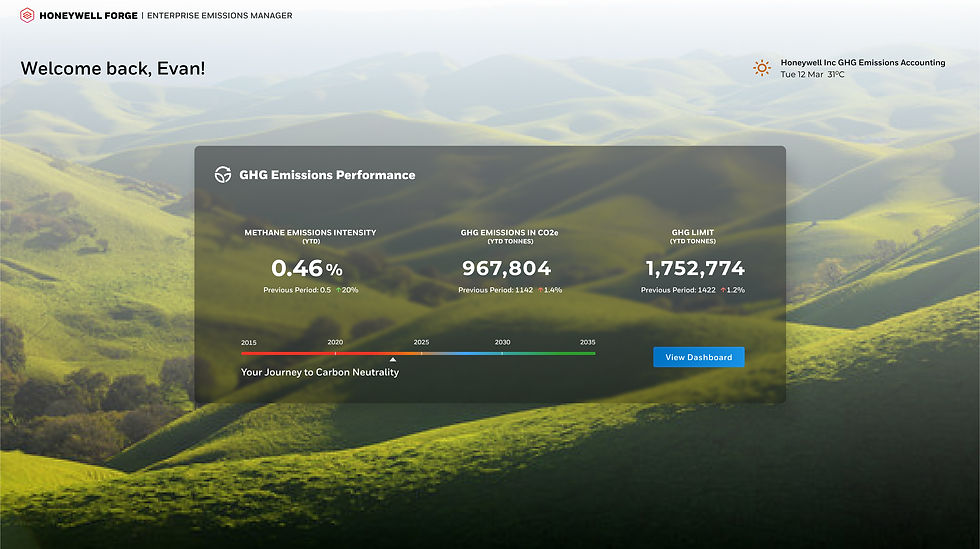
GHG emission performance screens provide a quick look at methane emission intensity, CO2e emissions, GHG limit year-to-date and progress toward carbon neutrality.
Methane intensity is the ratio of total methane emissions from upstream oil and gas activities to the total amount of gas production.
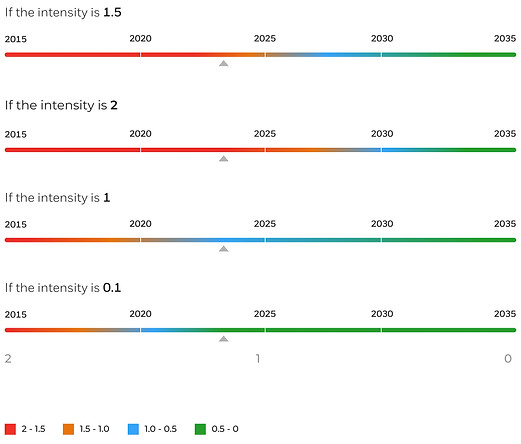
Interaction details of the journey to carbon neutrality indicator
Note: The carbon neutrality indicator is a measure of progress towards the goal of achieving zero net carbon emissions. This is an important metric for tracking efforts to reduce greenhouse gas emissions and combat climate change.
Enterprise Dashboard View
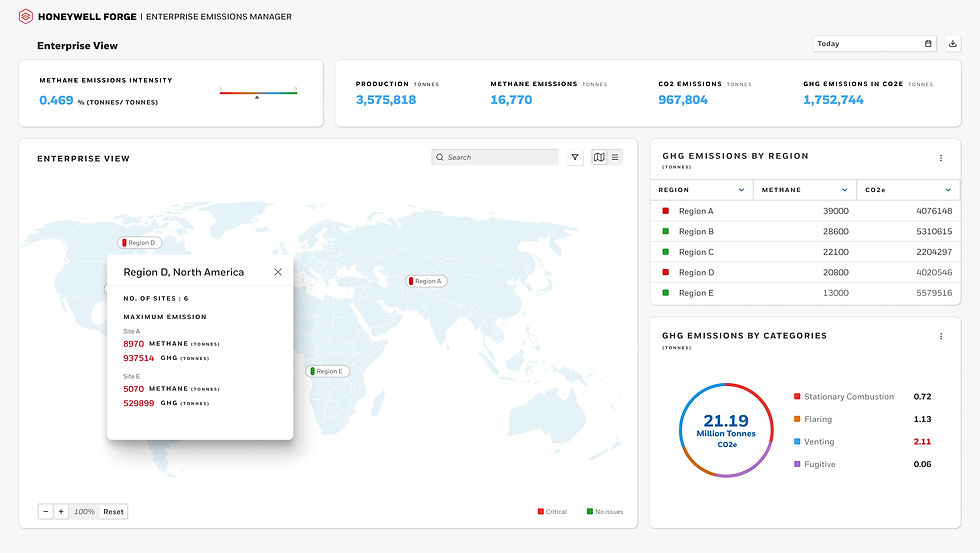
The CSO enterprise dashboard displays data on methane emission intensity, production, and maximum emissions by each region. It also includes a map view for checking emissions by region.
Enterprise Regional View
When you dive into the Region view, you can see the details of methane and greenhouse gas emissions categorised by type.
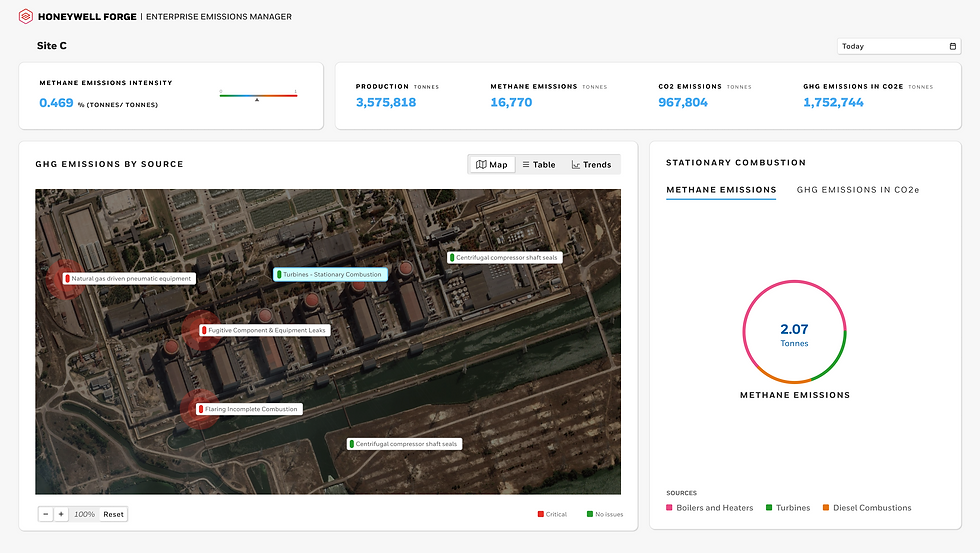
In Map view, hovering over the Sites badge displays the highest-emitting site. This allows the CSO to connect with the Site Manager and address the issue.

HSE Engineer Flow
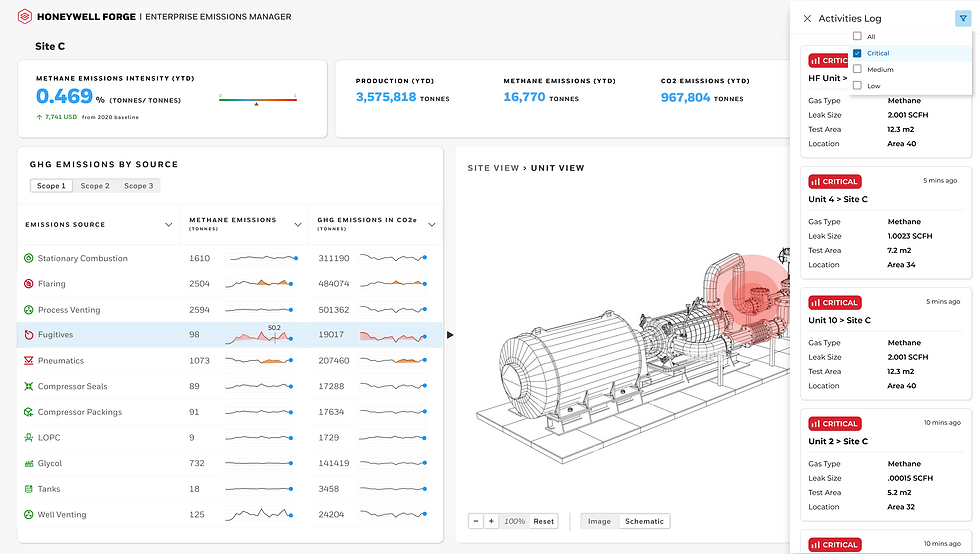
The HSE Engineer/Site Manager logs in and now can monitor methane and GHG emissions in his site
across 4 categories and 13 emission sources, with high emissions being flagged for attention.


Initial design approach
for Dashboard
In Dashboard, the feature allows a detailed analysis of the emissions from each unit and sub-source at the site. The site Engineer can investigate the size of any detected leaks and inform the plant manager or technician to take appropriate action. This includes a third-party tool, which can be used for further investigation of the leak.


Dashboard Final Design
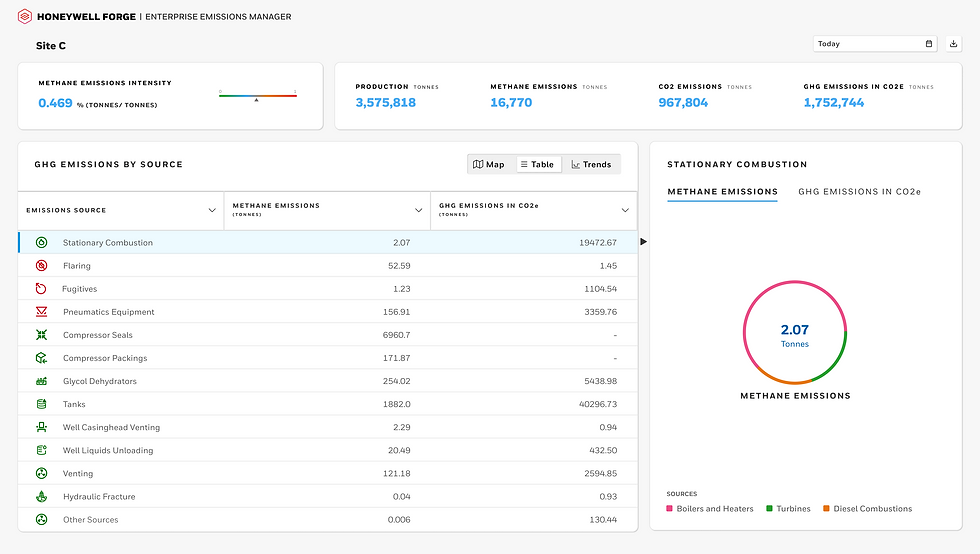
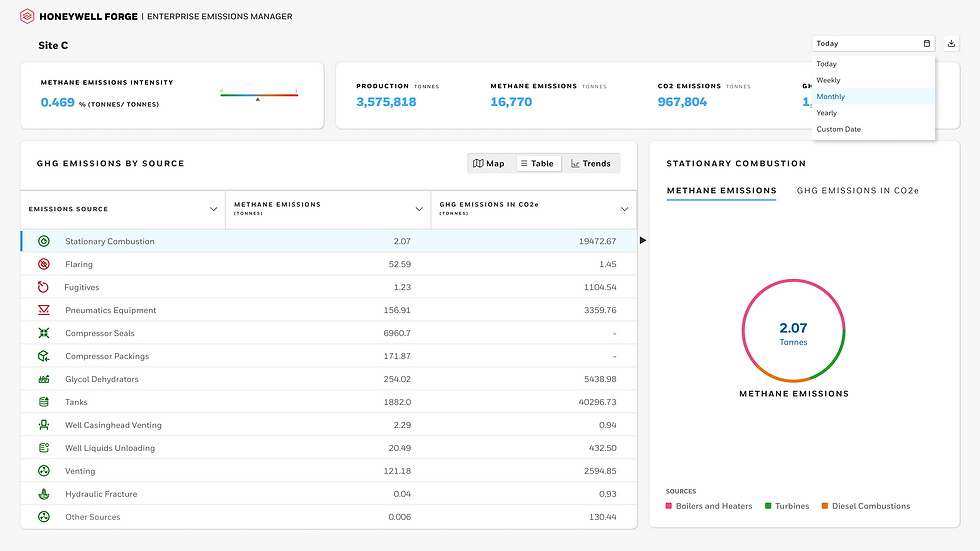
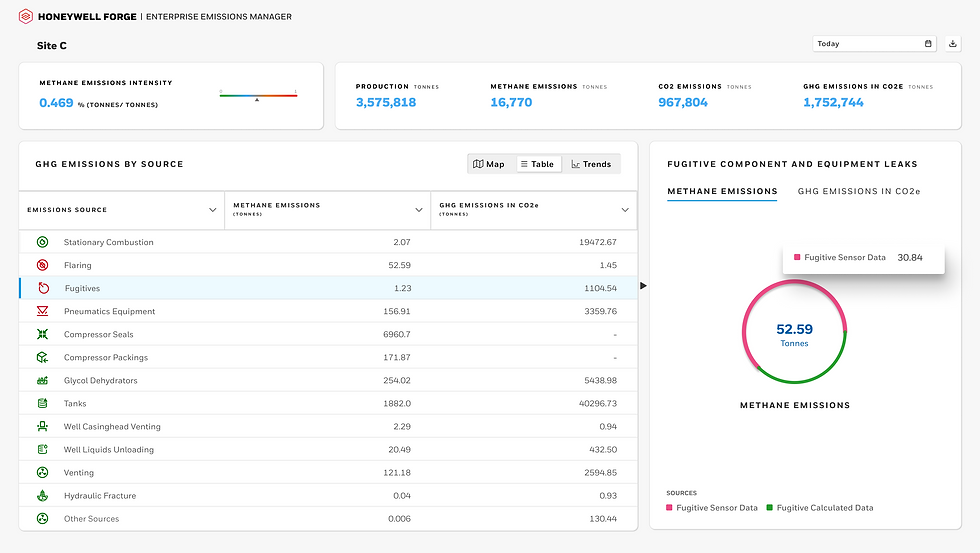
Based on the feedback we received, we removed third-party tools due to budget constraints and schematic images due to technical issues. Below is the recently updated table view with a doughnut chart to display data for each unit to provide a better solution. This new doughnut chart will enable site managers to make necessary decisions.
Map View
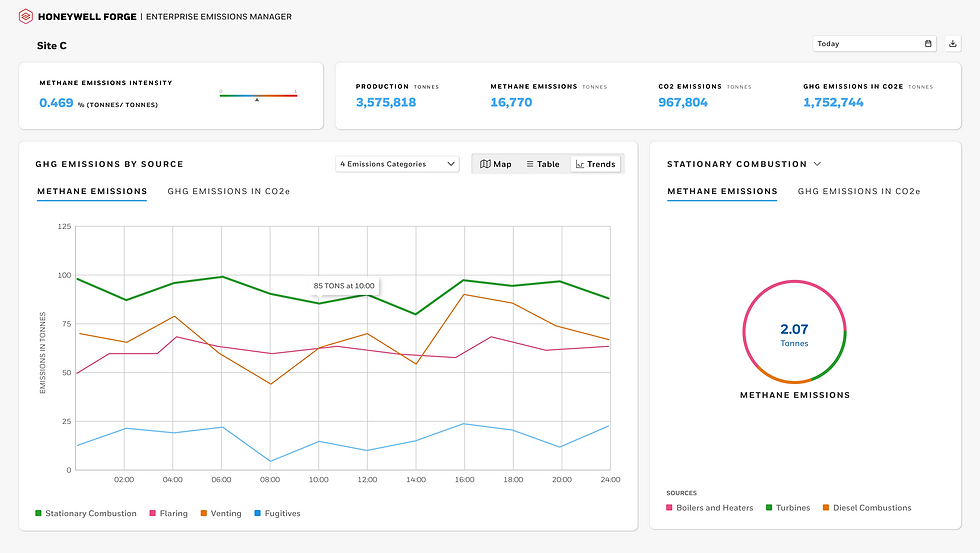
Trend View
Success metrics
Emission management reduced incident resolution times by 25%,
which had an impact on both user experience and business.
A rapid information access system for site engineers has a
20–30% productivity boost.